BANFF Tickets on Sale Now
While the past year has been unkind to the French Broad River, the Green River Watershed — a headwater tributary of the Broad River — had a great year. Alternatively, the larger Broad River Watershed’s 2020-2021 highlight reel is less glamorous, but we’re happy to report commendable water quality improvement across this important watershed.
We’ll split this blog post into three sections, starting with a summary of our upper French Broad River Watershed data. Then, we’ll discuss the data we collected across the Green River and greater Broad River Watershed, summarize the good and bad news for each, and spotlight the water testing sites with the lowest and highest bacteria counts. We’ll conclude with achievable solutions for the future and a call to action so you can continue to help usprotect the places we share.
Before we dive into our water quality summary, let’s review important terminology to help us better understand the data our Riverkeepers, volunteers, and Clean Waters teams worked so hard to collect, analyze, and report. Cfu, or colony forming unit, is a data metric scientists use to estimate the number of microbes present per 100 milliliters of a singular water sample. Microbes (also known as microorganisms) include bacteria, algae, and fungi. Like most things, some microbes are good for human health and some aren’t. We test for E. coli bacteria because it’s the best indicator for the presence of microbes that pose threats to human health.
According to the US Environmental Protection Agency (EPA), 235 cfu/100mL is the safe standard for primary recreational waters, where people are most likely to engage in recreational activities involving underwater immersion and potential water ingestion.
About Our Swim Guide Program
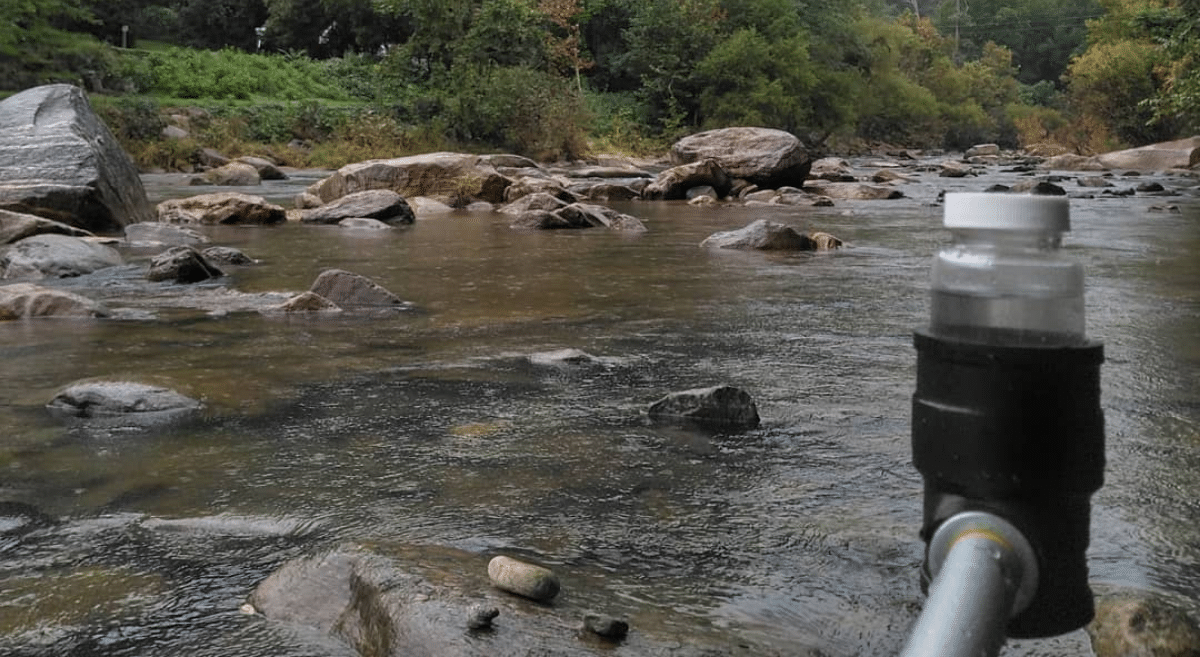
Swim Guide is an international program used by Riverkeepers and other advocates to provide up-to-date recreational E. coli data for beaches, lakes, and rivers worldwide. E. coli is a bacteria found in the fecal waste of warm-blooded animals, including humans, and indicates contamination in our waterways. E. coli levels increase with rainfall events due to surface runoff and sewer overflow events.
Samples are collected every Wednesday from Memorial Day to Labor Day. Volunteers collect surface water samples in a 100mL sample bottle and drop samples off at the lab, to be processed by MountainTrue staff. Results from samples are measured in MPN, the most probable number of colony-forming units (cfu). The EPA’s limit for recreational water quality is 235 cfu/100mL. The EPA estimates at that concentration, 8 in 1,000 people will contract an illness.
Pass/Fail results are updated every Friday on www.swimguide.org to inform the public about local water quality. We use the data generated from our Swim Guide Program to identify sites for follow-up sampling. We sample in both urban and rural areas. Determining the location and source of E. coli in our waterways is one way we can hold polluters accountable.
News headline: Upper French Broad Bedevilled by Bad Bacteria
The French Broad’s turbulent history with E. coli is well-known among watershed locals. Our two new testing sites along the upper French Broad at Lyons Mountain and Island Ford secured the top spots for worst water quality and highest bacteria count.
In Henderson County, Mud Creek at Brookside Camp Road experienced slight improvement from 2020 to 2021, but remains one of the worst sites we sample with an average E. coli count of 1535 cfu/100mL. Our data suggests a mix of animal agriculture, septic failures, and sewer overflows are the primary sources of E. coli pollution in Mud Creek.
The week of July 28 proved to be the summer’s worst. Just 23% of our French Broad River testing sites passed the EPA’s 235 cfu/100mL safe standard for primary recreational waters.
For more information about the larger French Broad River Watershed, check out this blog post.
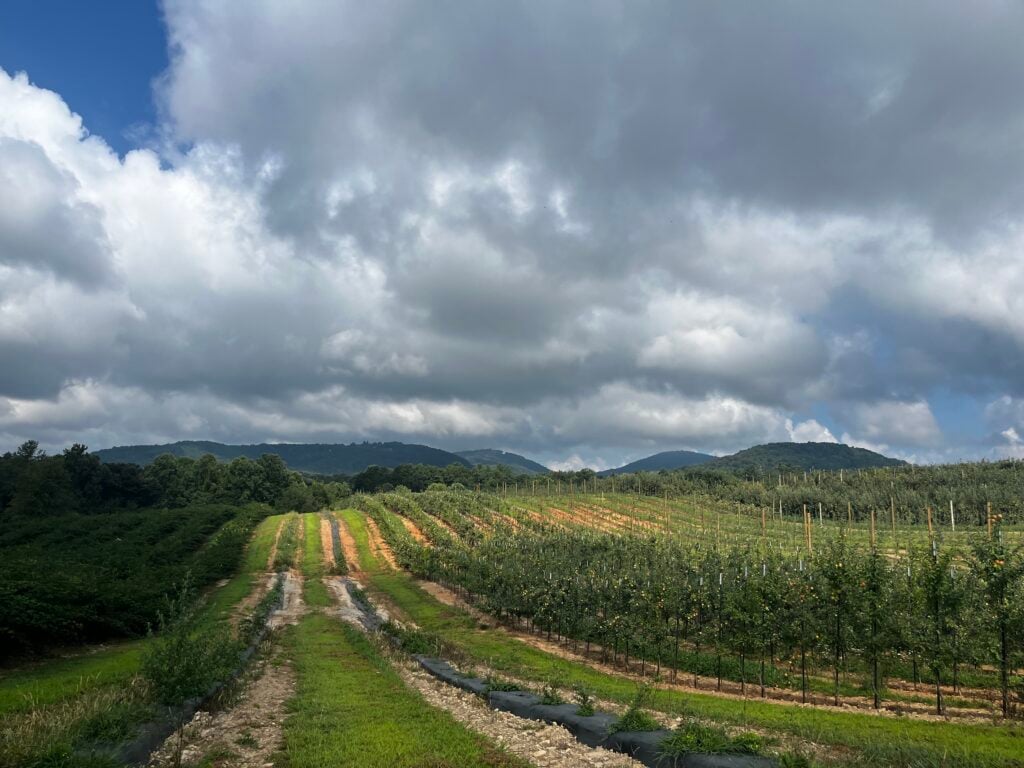
Good news headline: Green River Watershed Report Concludes ‘It’s Actually Pretty Easy Being Green’
We’re happy to report the past year saw the Green River Watershed boast no worst sites. With the exception of the week of August 18 during Hurricane Fred, all seven testing sites routinely passed the EPA’s safe standard throughout the summer.
Overall, the Green River’s water quality remains excellent for recreational users and fares much better than the French Broad River’s water quality. Out of 98 total samples, only nine failed to pass the EPA’s safe standard. Our data shows the Green River was clean 90.8% of the time we sampled it this summer.
Bad news headline:Rains of Climate Change Pose Threats to Overall Clean Green River
Users of the Green River Watershed enjoy a largely clean present. Still, the future is less certain with the potential for negative changes due to heavier summer rains. This summer saw Hurricane Fred wreak havoc across the watershed in mid-August, immediately resulting in poorer water quality. With an average value of 951.9 cfu/100mL per site, the week of August 18 proved to be the summer’s worst with six out of seven testing sites failing to pass the EPA’s safe standard.
Stormwater runoff pollution remains a formidable threat to the Green River Watershed and the whole of the Southern Blue Ridge. Without immediate and direct action, the Green River’s water quality will suffer as higher annual amounts of stormwater runoff enter the watershed due to climate change.
Good news headline:Broad River Somewhat Less Bacteria-laden in 2021 than 2020
Sampled weekly from Memorial Day to Labor Day, our data concludes slight water quality improvement at all nine testing sites across the Broad River Watershed in both Rutherford and Cleveland counties from 2020-2021. We’re happy to say that the river continues to be a safe, reliable recreation spot.
Cleveland County’s Moss Lake maintains the title of best testing site, passing the EPA safe standard 100% of the time over the past two years.
Bad news headline:Development and Manure are Broad River’s Biggest Bacteria Blunders
Buffalo Creek has remained our worst testing site for two years, failing to pass the EPA’s safe standard 81% of the time. The high bacteria concentrations in Buffalo Creek are attenuated in Moss Lake, just 15 miles upstream. The nutrients associated with Buffalo Creek’s high bacteria levels continue to pose a risk for algal blooms in Moss Lake. Not all algal blooms are dangerous, but those with the potential to form in Moss Lake would pose a severe risk to water quality and surrounding biodiversity.
Lake Lure and the Rocky Broad have mixed testing results. Coupled with existing agriculture, ongoing development surrounding the Rocky Broad is likely causing an increase of bacteria-laden runoff during rain events.
Data from our two testing sites along the First Broad River indicate that the water is unsafe for recreation roughly 33% of the time. Poor agricultural practices like inadequate stream buffers and abundant cow and poultry manure in the river are the likely sources for the First Broad’s high E. coli levels.
Let’s wrap up our water quality discussion with two future news headlines:
1) Governments Must Step in to Mitigate Green River’s Worsened Water Quality
Existing stormwater infrastructure is outdated and inadequate. Local and state government action is needed to protect the Green River’s water quality from threats posed by climate change.
2) Remedying Broad River’s Bacteria Problem with Sound Policy, Infrastructure and Agriculture Investments
Despite incrementally improved water quality at each testing site, data collected from the Broad River Watershed still produced less than ideal results. The prevalence of E. coli in the watershed illuminates a dire need for workable solutions to lackluster development policies, poor agricultural practices, and deficient stormwater infrastructure.
Moving forward, MountainTrue will:
Want to learn more about our efforts to bring about clean water for all? Check out our ILoveRivers webpage and join MountainTrue’s dedicated community of volunteers to help usprotect the places we share.