BANFF Tickets on Sale Now
In the past year, the Watauga River Watershed experienced a range of highs and lows (we’re talking about bacteria counts, folks!). We’ll start with the good news, including which water testing sites had the lowest bacteria counts across the watershed. Then, we’ll give you the year’s bad news by spotlighting sites with the highest bacteria counts. We’ll conclude with achievable solutions for the future and a call to action so you can continue to help usprotect the places we share.
Before we dive into our water quality summary, let’s review important terminology to help us better understand the data our Riverkeepers, volunteers, and Clean Waters teams worked so hard to collect, analyze, and report. Cfu, or colony forming unit, is a metric scientists use to estimate the number of microbes present per 100 milliliters of a singular water sample. Microbes (also known as microorganisms) include bacteria, algae, and fungi. Like most things, some microbes are good for human health and some aren’t. We test for E. coli bacteria because it’s the best indicator for the presence of microbes that pose threats to human health.
According to the US Environmental Protection Agency (EPA), 235 cfu/100mL is the safe standard for primary recreational waters, where people are most likely to engage in recreational activities involving underwater immersion and potential water ingestion.
Good news headline: Popular Watauga River Spots Still Safe for Recreation
Popular among anglers, swimmers, sunbathers, and kayakers, our water quality testing site at Guy Ford remains the only Watauga River site to have experienced a statistically significant decrease in E. coli levels from 2020-2021. With an average value of 80.3 cfu/100mL, Guy Ford passes the EPA’s 235 cfu/100mL safe standard with ease.
About Our Swim Guide Program
Swim Guide is an international program used by Riverkeepers and other advocates to provide up-to-date recreational E. coli data for beaches, lakes, and rivers worldwide. E. coli is a bacteria found in the fecal waste of warm-blooded animals, including humans, and indicates contamination in our waterways. E. coli levels increase with rainfall events due to surface runoff and sewer overflow events.
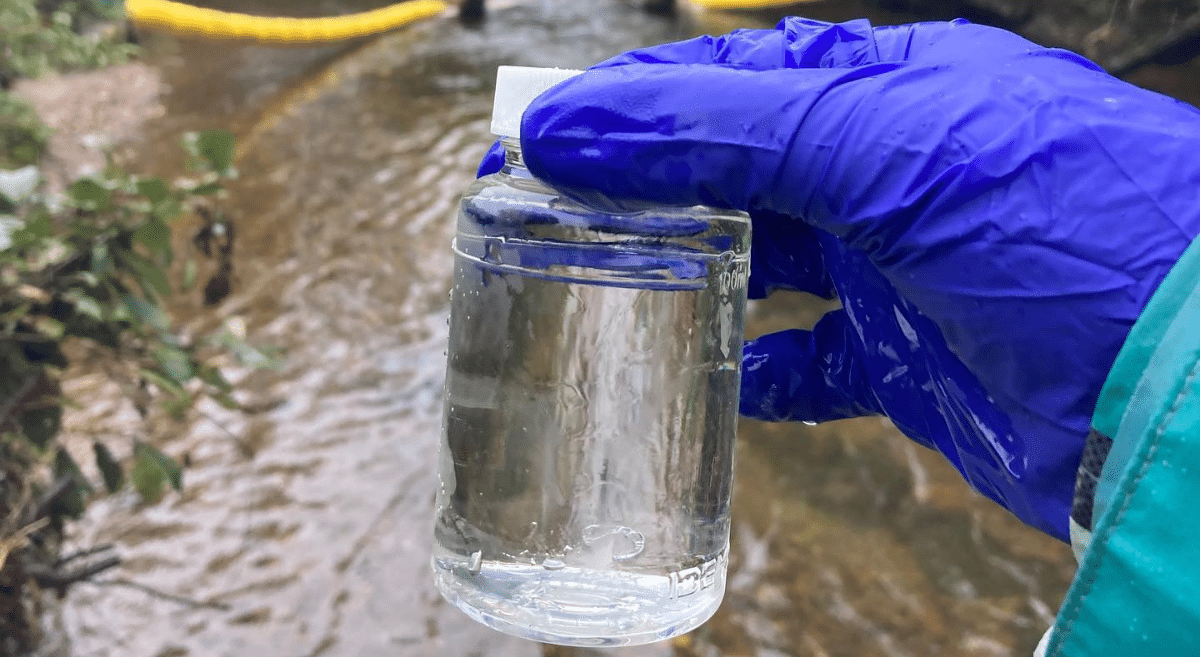
Samples are collected every Wednesday from Memorial Day to Labor Day. Volunteers collect surface water samples in a 100mL sample bottle and drop samples off at the lab, to be processed by MountainTrue staff. Results from samples are measured in MPN, the most probable number of colony-forming units (cfu). The EPA’s limit for recreational water quality is 235 cfu/100mL. The EPA estimates at that concentration, 8 in 1,000 people will contract an illness.
Pass/Fail results are updated every Friday on www.swimguide.org to inform the public about local water quality. We use the data generated from our Swim Guide Program to identify sites for follow-up sampling. We sample in both urban and rural areas. Determining the location and source of E. coli in our waterways is one way we can hold polluters accountable.
Our other best testing sitesof 2021 include the Upper Gorge Watauga Park off Highway 321, Watauga Point, Wilbur Dam, Shook Branch, and Price Lake. All five sites passed the EPA’s safe standard.
Data collected from 76% of all 18 sampled sites reported no statistically significant change this year, meaning E. coli levels did not increase or decrease from 2020-2021. While this isn’t the result we’d hoped for, we’ll take it.
Bad news headline: E. Coli has a Dirty Affair with Lover’s Lane and Other Popular Spots in the Watauga River Watershed
Our data showcases the pressing need for water quality improvement across the Watauga River Watershed. Unfortunately, sites along the Watauga, New, and Elk Rivers rank among the Watauga River Watershed’s worst testing sites. This year, popularWatauga River accesses like Lover’s Lane, Hunter Bridge, and Blevins Road Boat Ramp experienced alarming increases in bacteria concentrations.
Our Lover’s Lane site secured the top worst spot with an average E. coli count of 1754.9 cfu/100mL. Average E. coli levels were approximately three times the EPA’s 235 cfu/100mL safe standard at Hunter Bridge and Blevins Road Boat Ramp.
With E. coli levels above 590 cfu/100mL, both Elk River Falls and the New River’s Todd Island Park failed to pass the EPA’s safe standard. The latter, along with the New River’s Boone Greenway, ranked among Watauga County’s worst sites of 2021. Our Watauga River testing site off Calloway Road also fared poorly.
This year we saw 17% of our water quality testing sites experience increased overall E. coli levels compared to 2021. This increase is not considered statistically significant due to the wide variation among this year’s water quality samples, taken weekly during the 15 weeks between Memorial Day and Labor Day.
Our weekly sampling often took place after or during a rain event. We believe that likely contributed to this year’s wide variation in average E. coli levels, which was double that of 2020’s.
This year’s increase in average E. coli levels is a concerning trend across the watershed. The average E. coli count for 2021’s 15-week sampling period was 408.04 cfu/100mL, up from 2020’s average of 238.76 cfu/100mL.
Hurricane Fred caused the week of August 18 to be the summer’s worst. After Fred’s heavy rainfall and flash flooding events, the watershed’s E. coli levels skyrocketed to 1222 cfu/100mL. Additional rain events correlated with the summer’s other average E. coli level peaks.
Future news headline:Direct Action Needed to MitigateImpacts of Climate Change, Increased Development, and Tourism Across Watauga River Watershed
A symptom of climate change, increased annual rainfall and flash flooding events, will undoubtedly cause a decline in water quality across the watershed. Growing tourism pressure and resulting development projects will continue to exacerbate the existing strain on our region’s failing infrastructure.
If left unchecked, stormwater infrastructure deficiencies will open the literal and figurative flood gates, allowing increased polluted and bacteria-laden stormwater runoff to enter local waters.
Moving forward, MountainTrue will:
Want to learn more about our efforts to bring about clean water for all? Check out our ILoveRivers webpage and join MountainTrue’s dedicated community of volunteers to help usprotect the places we share.