BANFF Tickets on Sale Now
The 2021 State of the River Reports are finally here! In this blog, we’ll discuss the cleanliness and water quality of the French Broad, Broad and Green, and Watauga River watersheds.
There are four sets of data that MountainTrue uses to formulate our water quality rankings for each stream, including:
The data from testing sites in streams across each watershed are weighed, and each stream is given a letter grade. The grading scale is as follows:
A (90-100): These streams have excellent water quality, low pollution levels, and healthy aquatic insect and fish populations.
B (80-89): These streams have good water quality but some impacts from pollution or development. The aquatic life and fish populations are relatively healthy.
C (70-79):These streams have average water quality. There are some concerns about pollution inputs and development impacts. Generally, aquatic life and fish populations are healthy but could become negatively impacted
D (60-69): These streams have below-average water quality. Pollution is a concern, and aquatic life and fish populations are not as healthy as they should be.
F (<60): These streams have poor water quality. Pollution levels are often high, and aquatic life and fish populations are impacted.
When comparing this year’s report to 2018’s report, it’s important to note that the way we process our water samples for E.coli at MountainTrue has changed. Up until 2018, we used an Environmental Protection Agency (EPA)-approved method using Coliscan Easygel. The results from this method were sometimes subjective and thus could be less accurate. In 2019, we switched to another EPA-approved protocol, using the Idexx system. Those results are quicker, more objective, and more accurate. This 2021 report includes E.coli data from both analysis methods (2018 Swim Guide data using Coliscan Easygel and 2019-2021 Swim Guide data using the Idexx system).
Now, let’s review the findings from each of the three reports.
Of the 62 testing sites across the French Broad River Watershed, 16% received an A grade, 20.9% received a B grade, 29% received a C grade, 25.8% received a D grade, and 6% received an F grade.
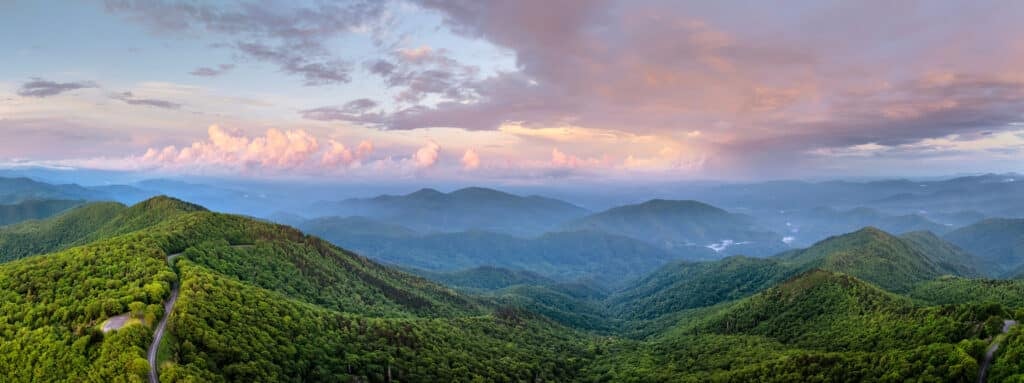
Overall, we observe a general decline in water quality. We attribute this to two primary factors — climate change and increasing construction and development throughout the watershed. Asheville and the surrounding region have experienced more frequent heavy rains in the last several years. Climate change in the Southern Blue Ridge region is expected to present random “boom and bust” patterns in precipitation, seen as floods and droughts in our region. This causes increased stormwater runoff from urban areas and agriculture operations, along with more sewer overflows and saturated septic fields surrounding failing septic systems. It also brings extra sediment into our waterways from construction sites and weak riverbanks, which can smother aquatic habitats, increase water temperature, and transport toxins into our rivers. All of this is happening during a period of unprecedented recreational growth on the French Broad.
We documented the most dramatic change in Transylvania County, as the quality of the Upper French Broad decreased significantly. We attribute part of this decrease in quality to our transition to new, more accurate E.coli sampling protocols. However, that doesn’t explain the whole picture since water quality in other parts of the watershed didn’t drop as steeply. Notoriously the wettest county in the state, this drop in water quality is indicative of the effects that a changing climate coupled with increasing development is having on our region.
On a positive note, the Nolichucky Watershed saw increased water quality with high grades in benthic and fish samples. Such pristine waters cannot be taken for granted, which is why we’re advocating for the Nolichucky River between Poplar, NC, and Erwin, TN, to be permanently protected with a Wild and Scenic Rivers designation.
Four Cleanest Streams:
Four Dirtiest Streams:
Of the 18 testing sites across the Broad and Green River watersheds, 27% received an A grade, 61% received a B grade, none received a C grade, 5.5% received a D grade (1 site), and 5.5% received an F grade (1 site).
The Green River is the largest tributary of the Broad River in North Carolina, and its headwaters are largely protected. From its source in Henderson County to Lake Summit, the Upper Green is significantly impacted by agriculture, poor stream management practices, and lack of appropriate riparian buffers.
The Green River flows into the Broad River near the Polk and Rutherford County Line. Major tributaries in the lower Green River Watershed include Walnut Creek from the north and White Oak Creek from the south. In a tale of two tributaries, the former touts excellent water quality and benefits from a large nature preserve while the latter suffers from degraded water quality as a result of development, land clearing, agriculture, and other intensive land use.
By the time the First Broad reaches Shelby, it fails to meet EPA bacteria standards nearly 50% of the time. First Broad tributary Buffalo Creek has a history of high bacteria levels and feeds Moss Lake — Cleveland County’s only public reservoir and the water supply for Kings Mountain. In June 2020, NC DEQ documented Moss Lake’s first-ever harmful algal bloom (HAB) — this is a big concern for nearby residents, recreationists, and all who depend on Moss Lake for their drinking water supply.
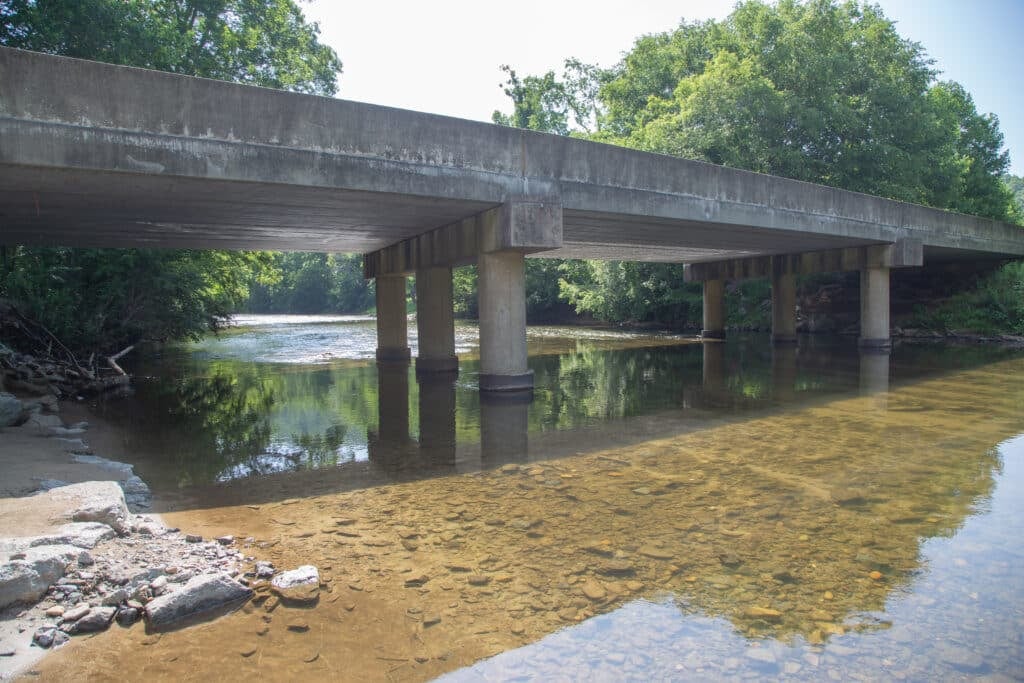
Overall, water quality in the most popular recreational area on the main stem of the Broad River is pretty good. The river is so large that contaminants of concern in the tributaries are diluted, and bacteria levels at the Broad River Greenway in Cleveland County almost always meet EPA standards for safe recreation.
Four Cleanest Streams:
Four Dirtiest Streams:
Of the 27 testing sites in the Watauga River Watershed, 37% received an A grade, 33% received a B grade, 11% received a C grade, 3.7% received a D grade (1 site), and 14.8% received an F grade.
Overall, water quality is pretty good across the Watauga River Watershed, which originates at an elevation of 5,964 feet on the northern slopes of North Carolina’s Grandfather Mountain. The 78-mile-long Watauga River Basin includes the headwaters and tributaries of the Elk and Watauga Rivers, flowing northwest from North Carolina into Tennessee’s Holston and Tennessee Rivers before joining the Mississippi River and draining into the Gulf of Mexico.
The Watauga River Watershed includes mountain bog wetlands that sit at the head of the basin and serve as an important water purification system and habitat for native wildlife. Nearly 90% of mountain bogs in North Carolina and throughout the Southeastern United States have been destroyed. The rapid elimination of mountain bogs poses a challenge for water quality and environmental conservation in the Watauga River Basin.
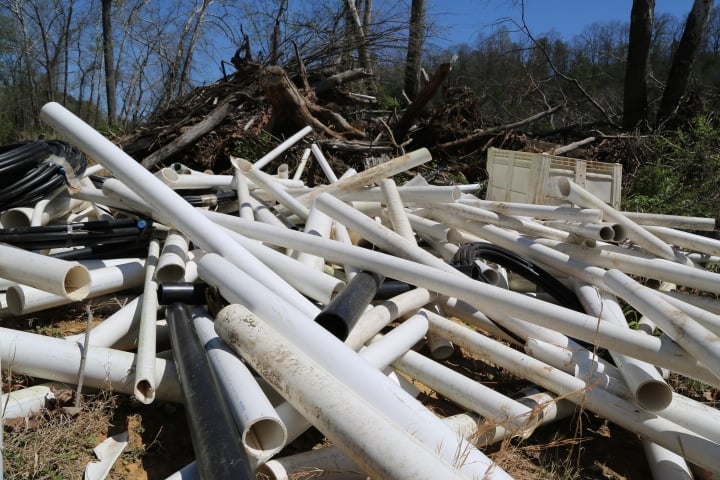
Increases in development, plastic pollution, soil erosion, sedimentation, and excess nutrients are stressors on aquatic health and habitats. When combined, these stressors can significantly damage aquatic habitats and ecosystems. Much of the land disturbance in the basin takes place on steep mountain slopes, which are naturally vulnerable to soil erosion. As land is cleared due to urbanization and agriculture, rain and melting snow carry eroded sediments, pesticides, fertilizers, and road salt into the Watauga River.
Fortunately, North Carolina has designated 18 miles along Boone’s Fork Creek for conservation to receive extra protection. More than half of the basin’s streams are classified as trout waters and thus require additional treatment at local wastewater treatment plants. In addition, 25-foot buffers of shrubs and trees must be maintained between trout streams and graded construction sites to filter runoff and prevent erosion.
Four Cleanest Streams:
Four Dirtiest Streams: