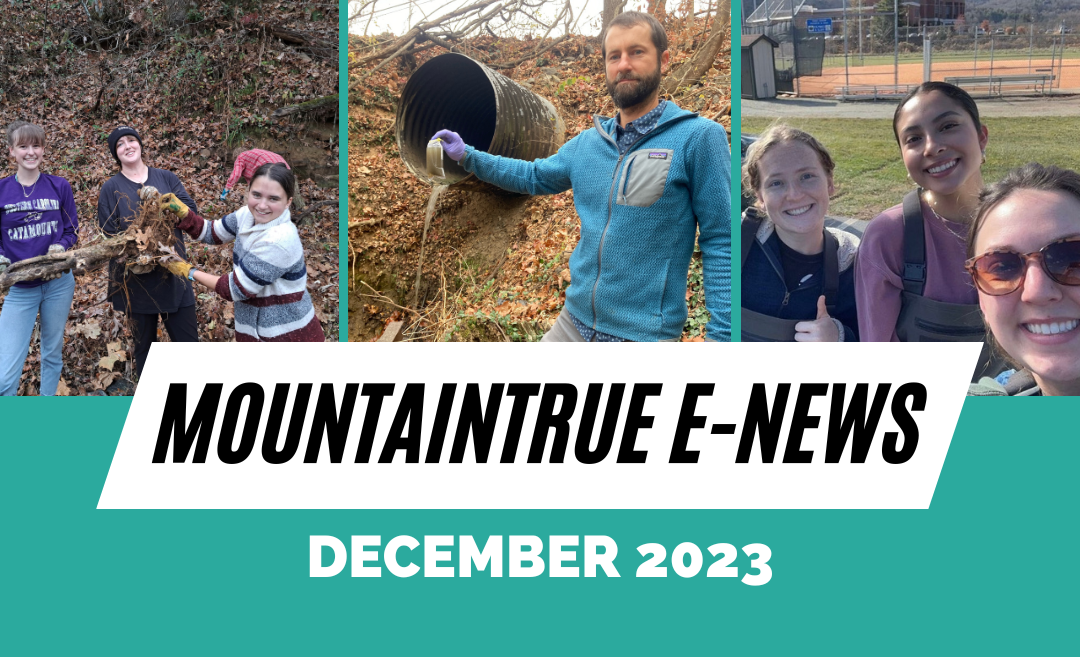
MountainTrue’s December 2023 E-Newsletter
MountainTrue’s
December 2023 E-Newsletter
December news from MountainTrue’s four regional offices:
Central Region News
Click here to read
High Country News
Click here to read
Southern Region News
Click here to read

Western Region News
Click here to read
A note from Executive Director Bob Wagner:
For me, this is a season of contrasts; the fallen bright yellow leaves on the trail have now faded to brown. It’s cold, the nights are long, and there’s so much despair in the world.
On the other hand, I’m much more likely to notice the sunrise (because it happens later). Amongst the bare trees, it’s easier to see the active birds. The forest’s understory is clear, enabling you to see previously hidden landscapes and majestic mountain ridges. And, when you look up, you’re greeted by a wide-open blue sky.
During this season of festivities, my hope for you is that you take it all in. Settle into the darkness and listen. Feel the calm, quietness of the night. Daybreak will assuredly come, and when it does, take a moment to wonder and marvel at this incredible place where we live.
I’m grateful for you, and we appreciate the support you have given us this year to protect our forests, our rivers, and our mountains.
Forever MountainTrue,
Bob
Central Region News

Madison County action alert: tell county officials to protect mountain ridges
On December 19, the Madison County Planning Board will be considering a drastic change to their Mountain Ridge Protection Ordinance that would threaten the natural beauty and environmental integrity of the county. They will then make their recommendation to the County Commission, which could consider the rule change in January. The county has received an application from a private citizen to amend the county’s Mountain Ridge Protection Ordinance and do away with a 50’ setback requirement, a key provision that protects mountain ridges from development. After nearly 200 people attended the initial hearing in November, the board decided to push the hearing to this month. Take action by:
- Emailing your Madison County Commissioners & Planning Board
- Attending the Planning Board meeting happening from 6:30 – 7:30 p.m. tomorrow (Tuesday, December 19) at the Marshall Library (1335 N Main St. Marshall, NC 28753)


Photos: French Broad Riverkeeper Hartwell Carson (left) collects a water sample from a drainage pipe. MountainTrue Watershed Science & Policy Manager Anna Alsobrook (right) dyeing a sewer line to ID the source of the leak.
An update on local sewage leaks from the French Broad Riverkeeper team
Three weeks ago, the French Broad Riverkeeper team received a pollution report about a possible sewage leak near Charlotte Street in Asheville. The Riverkeeper team immediately investigated by taking water samples to check for the presence of E. coli. Sampling results showed elevated levels of E. coli bacteria over 25 times the safe standard set by the Environmental Protection Agency (EPA). Our return sampling trip two days later showed the pollution levels had doubled.
We conducted a follow-up investigation to track the source of the pollution, which involved sampling multiple up and downstream locations and dropping colored dye into the sewer lines in hopes that the color would show up in the creek and reveal the leak’s location. As is often the case, finding the exact source of the pollution proved tricky. Another round of dyeing the sewer lines didn’t reveal the source, but our sampling data showed the E. coli pollution levels had increased to over 510 times the EPA’s safe standard. We called in the Metropolitan Sewer District (MSD) to help isolate the source by lowering their remote camera into the sewer line to pinpoint the leak. The sewer cam found the leak, and MSD made the necessary repairs.
Finding the sources of pollution can be frustratingly slow sometimes, but we don’t give up, and we rely on the public to report problems they see. So, don’t hesitate to reach out if you see or smell anything weird in your local waterways — we’re ready to investigate!
Upcoming site improvements along the French Broad Paddle Trail in Transylvania County
We’re thrilled to have just received a grant from the Transylvania County Tourism Development Authority’s Tourism Funding Program for pre-construction site design and permitting related to improvements at Lyons Mountain River Access on the French Broad River. When paired with an allocation from the North Carolina State Trails’ Complete the Trails Fund, we are all set to proceed with fulfilling the engineering and regulatory steps related to improvements identified in the Strategic Master Plan for the French Broad River Blueway.
These improvements include expanding the site in its current location and/or to the NCDOT-managed right-of-way across the river, replacing the eroding steps with a concrete boat ramp, adding picnic tables, installing a kiosk and signage, and stabilizing eroding stream banks with native riparian vegetation.
This is just one of many projects that our French Broad Paddle Trail program is currently working on. Contact MountainTrue’s French Broad Paddle Trail Manager, Jack Henderson, at jack@mountaintrue.org for more information or to get involved.
Give!Local 2023
MountainTrue is honored to be among the 52 local nonprofits included in the 2023 Mountain Xpress Give!Local campaign. Click here to learn more about Give!Local and click here to donate to MountainTrue through the online giving campaign, which runs until December 31.
Changes to MountainTrue’s Guided Adventures
Beginning in 2024, Guided Adventures will be included in our monthly e-news. In an effort to reduce the number of emails you receive from us, we will no longer have a separate email launch for these. Please make sure to pay attention to the events section to grab your tickets. Current members will receive discounted tickets to select MountainTrue events. Also coming in 2024: discounted tickets for youth AND expanded volunteer opportunities in the Central Region. We hope to see you at a MountainTrue event next year!

Photo: An iconic selfie of retired MountainTrue Ecologist & Public Lands Director Bob Gale.
Brainy Brews for MountainTrue: January 17 at the River Arts District Brewing Company
Join us on January 17, 2024, for a free educational event led by retired MountainTrue ecologist Bob Gale at the River Arts District Brewing Company in Asheville! Bob will discuss issues related to invasive plants, methods of control, and ideas for moving your yard toward a more natural ecosystem. Programming will be from 6-7 p.m., but come at 5:30 p.m. to grab a drink and get settled in. (Popcorn is available on site, and guests are welcome to bring their own food). Register here.
Bob’s background includes landscaping, arboriculture, and wetland science, and he has worked as a forest ecologist in coastal, piedmont, and mountain regions of the Southeast. Bob wrote the natural history portions of the book A Highroad Guide to the North Carolina Mountains and co-authored A Beachcomber’s Guide to Fossils with his wife and son.
Webinar: Why Should Environmentalists Support Building More Housing?
We know that healthy communities exist within the context of a healthy environment, and right now, both are threatened. There is a housing shortage across the country, with many hard-working families unable to find a place to live. There is also a climate crisis, with greenhouse gas emissions threatening the stability of all our planet’s ecosystems and biodiversity. Join us from 5:30-6:30 p.m. on January 22, 2024, to learn more about MountainTrue’s newest program, Neighbors for More Neighbors WNC, and about part of the solution to both these crises. This is a virtual event; registered participants will receive the webinar link prior to the event date. Register here.
We’re excited to announce our 1st Native Plant & Shrub Sale in Asheville!
The sale will open online on February 15 and will run through March 31, 2024, featuring native plants and shrubs grown by Carolina Native Nursery (think azaleas and more!). Proceeds from the sale will benefit MountainTrue. Orders will be available for pickup on Thursday, April 11, from 4 p.m. to 7 p.m. ONLY, unless prior arrangements have been made. We hope you’re as excited about this as we are! What better way to get a head start on Earth Day than by showing your yard and resident pollinators a little local love?!
Save the date: cheers to trivia & good brews for MountainTrue
Beat the winter blues and join us for trivia and the River Arts District Brewing Company’s MountainTrue Beer Launch at 7 p.m. on Tuesday, February 20, 2024.
Helping more of our neighbors find homes + putting a dent in our housing shortage in 2023
The Joint Center for Housing Studies at Harvard University recently released its annual “State of the Nation’s Housing” report. The report provides a detailed summary of US housing and rental market trends. Construction of multifamily housing has increased significantly year over year, slowing rent growth and raising vacancy rates in the rental market. However, there continues to be a vast housing shortage, especially homes affordable to low-income families. Follow our Neighbors for More Neighbors WNC program to learn how to help solve our housing shortage and the climate crisis.
Septic system repair grants available for qualifying property owners
MountainTrue has partnered with the North Carolina Department of Health and Human Services (DHHS) and local health departments to provide septic system repair grants to qualifying property owners in Buncombe, Cherokee, Haywood, Henderson, Macon, Madison, Mitchell, Transylvania, and Yancey counties, as well as several other counties across WNC. Residents of rural areas outside of town are highly likely to have onsite septic systems. Problems with septic systems usually arise as systems age or when maintenance is neglected. Property owners: review eligibility requirements and apply for the repair program here.
Weigh in on opportunities to expand transit services across WNC
The Western North Carolina (WNC) Regional Transit Plan (RTP) is developing a transit study to evaluate current transit service in the region to identify improvements and enhance regional connectivity to the overall transit service. This survey will collect your thoughts about the community’s mobility needs and expectations for transit service, helping them shape the future of transit.
High Country News
Celebrating tourism and hospitality partners
The Watauga Riverkeeper team attended the 2nd annual Discover Watauga Tourism Summit on November 9. This event celebrated the stakeholders and tourism partners of Watauga County and Explore Boone, who help showcase what makes our region so special. The annual summit awards and recognizes groups for their contributions to the community and our thriving tourism industry! It was wonderful to reconnect with old friends and make new ones; we can’t wait to see what we’re about to celebrate next year!

Photo: High Country Intern Emma Crider takes a selfie with volunteers from ASU’s Community Engaged Leadership cohort before cleaning out the Winkler’s Creek Trash Trout.
ASU Community Fellows Trash Trout cleanouts
Over the course of the fall semester, we’ve enjoyed working with the Appalachian State University Community Fellows group at the Winkler’s Creek Trash Trout. This dedicated group of girls has worked with us monthly on Thursday afternoons to assist with Trash Trout and streambank cleanouts, trash inventories, and educational workshops. We love working with school groups dedicated to protecting the places we share, and we learn from them as much as we teach. Thank you, ASU Community Fellows, for a great semester of keeping our rivers clean!
Feeling the love from the Speckled Trout and Blowing Rock
Our last pint night of 2023 was nothing short of awesome! Our friends at the Speckled Trout hosted a fun-filled evening with great folks and great food on December 7. It was a wonderful night celebrating past successes, meeting new friends in Blowing Rock, and discussing how our team can better support and monitor the Blowing Rock, NC, region. Many thanks to our friends and community partners who show us endless support year after year!

Photo: Jonathan Hartsell of Blue Ridge RC & D poses for a photo with some live stakes at a recent workday at the old Ward’s Mill Dam site.
Live staking workdays
Live staking season is officially here, and we’re ready to get back into action! The live stakes we planted last season at the old Ward’s Mill Dam site and Valle Crucis Community Park are doing great, and it will be so exciting to see their growth during upcoming workdays this spring. Stay tuned for 2024 live staking dates — we can’t wait to see you all in the New Year! Happy Holidays from our Riverkeeper family to yours!
Changes to MountainTrue’s Guided Adventures
Beginning in 2024, Guided Adventures will be included in our monthly e-news. In an effort to reduce the number of emails you receive from us, we will no longer have a separate email launch for these. Please make sure to pay attention to the events section to grab your tickets. Current members will receive discounted tickets to select MountainTrue events. Also coming in 2024: discounted tickets for youth AND expanded volunteer opportunities in the Central Region. We hope to see you at a MountainTrue event next year!
Give!Local 2023
MountainTrue is honored to be among the 52 local nonprofits included in the 2023 Mountain Xpress Give!Local campaign. Click here to learn more about Give!Local and click here to donate to MountainTrue through the online giving campaign, which runs until December 31.
Webinar: Why Should Environmentalists Support Building More Housing?
We know that healthy communities exist within the context of a healthy environment, and right now, both are threatened. There is a housing shortage across the country, with many hard-working families unable to find a place to live. There is also a climate crisis, with greenhouse gas emissions threatening the stability of all our planet’s ecosystems and biodiversity. Join us from 5:30-6:30 p.m. on January 22, 2024, to learn more about MountainTrue’s newest program, Neighbors for More Neighbors WNC, and about part of the solution to both these crises. This is a virtual event; registered participants will receive the webinar link prior to the event date. Register here.
Helping more of our neighbors find homes + putting a dent in our housing shortage in 2023
The Joint Center for Housing Studies at Harvard University recently released its annual “State of the Nation’s Housing” report. The report provides a detailed summary of US housing and rental market trends. Construction of multifamily housing has increased significantly year over year, slowing rent growth and raising vacancy rates in the rental market. However, there continues to be a vast housing shortage, especially homes affordable to low-income families. Follow our Neighbors for More Neighbors WNC program to learn how to help solve our housing shortage and the climate crisis.
Weigh in on opportunities to expand transit services across WNC
The Western North Carolina (WNC) Regional Transit Plan (RTP) is developing a transit study to evaluate current transit service in the region to identify improvements and enhance regional connectivity to the overall transit service. This survey will collect your thoughts about the community’s mobility needs and expectations for transit service, helping them shape the future of transit.
Southern Region News
Recycle your live Christmas trees & wreaths on January 6
Mark your calendars for another tree recycling event: January 6, 2024, from 9 a.m. to 2 p.m. at Jackson Park (801 4th Avenue East, Hendersonville, NC)! As you go out to buy your live trees for the holidays, remember that you’ll be able to bring them to this event and collect mulch for your home gardens and landscaping. Also, are you planning a big appliance purchase for the season? Hold onto that foam! The Henderson County Solid Waste Department will be collecting foam to be recycled at the foam densifier.

Photo: A trail cam photo documenting a black bear utilizing a WNC wildlife crossing. Image credit: Safe Passage Coalition via smokiessafepassage.org.
Hendersonville Green Drinks returns January 11
Join us at Trailside Brewing Co. for the next installment of Hendersonville Green Drinks from 5:30-7 p.m. on Thursday, January 11, 2024! We’ll hear from Dr. Liz Hillard, Senior Wildlife Biologist for Wildlands Network, who will highlight and discuss research findings from two wildlife road crossing projects in Western North Carolina. Her research includes monitoring reptile road underpasses for wildlife use in Gorges State Park and evaluating bear, deer, and elk road conflict areas along I-40 in the Pigeon River Gorge. Click here to learn more.
Upcoming site improvements along the French Broad Paddle Trail in Transylvania County
We’re thrilled to have just received a grant from the Transylvania County Tourism Development Authority’s Tourism Funding Program for pre-construction site design and permitting related to improvements at Lyons Mountain River Access on the French Broad River. When paired with an allocation from the North Carolina State Trails’ Complete the Trails Fund, we are all set to proceed with fulfilling the engineering and regulatory steps related to improvements identified in the Strategic Master Plan for the French Broad River Blueway.
These improvements include expanding the site in its current location and/or to the NCDOT-managed right-of-way across the river, replacing the eroding steps with a concrete boat ramp, adding picnic tables, installing a kiosk and signage, and stabilizing eroding stream banks with native riparian vegetation.
This is just one of many projects that our French Broad Paddle Trail program is currently working on. Contact MountainTrue’s French Broad Paddle Trail Manager, Jack Henderson, at jack@mountaintrue.org for more information or to get involved.
Webinar: Why Should Environmentalists Support Building More Housing?
We know that healthy communities exist within the context of a healthy environment, and right now, both are threatened. There is a housing shortage across the country, with many hard-working families unable to find a place to live. There is also a climate crisis, with greenhouse gas emissions threatening the stability of all our planet’s ecosystems and biodiversity. Join us from 5:30-6:30 p.m. on January 22, 2024, to learn more about MountainTrue’s newest program, Neighbors for More Neighbors WNC, and about part of the solution to both these crises. This is a virtual event; registered participants will receive the webinar link prior to the event date. Register here.
Give!Local 2023
MountainTrue is honored to be among the 52 local nonprofits included in the 2023 Mountain Xpress Give!Local campaign. Click here to learn more about Give!Local and click here to donate to MountainTrue through the online giving campaign, which runs until December 31.
Changes to MountainTrue’s Guided Adventures
Beginning in 2024, Guided Adventures will be included in our monthly e-news. In an effort to reduce the number of emails you receive from us, we will no longer have a separate email launch for these. Please make sure to pay attention to the events section to grab your tickets. Current members will receive discounted tickets to select MountainTrue events. Also coming in 2024: discounted tickets for youth AND expanded volunteer opportunities in the Central Region. We hope to see you at a MountainTrue event next year!
Helping more of our neighbors find homes + putting a dent in our housing shortage in 2023
The Joint Center for Housing Studies at Harvard University recently released its annual “State of the Nation’s Housing” report. The report provides a detailed summary of US housing and rental market trends. Construction of multifamily housing has increased significantly year over year, slowing rent growth and raising vacancy rates in the rental market. However, there continues to be a vast housing shortage, especially homes affordable to low-income families. Follow our Neighbors for More Neighbors WNC program to learn how to help solve our housing shortage and the climate crisis.
Septic system repair grants available for qualifying property owners
MountainTrue has partnered with the North Carolina Department of Health and Human Services (DHHS) and local health departments to provide septic system repair grants to qualifying property owners in Buncombe, Cherokee, Haywood, Henderson, Macon, Madison, Mitchell, Transylvania, and Yancey counties, as well as several other counties across WNC. Residents of rural areas outside of town are highly likely to have onsite septic systems. Problems with septic systems usually arise as systems age or when maintenance is neglected. Property owners: review eligibility requirements and apply for the repair program here.
Weigh in on opportunities to expand transit services across WNC
The Western North Carolina (WNC) Regional Transit Plan (RTP) is developing a transit study to evaluate current transit service in the region to identify improvements and enhance regional connectivity to the overall transit service. This survey will collect your thoughts about the community’s mobility needs and expectations for transit service, helping them shape the future of transit.
Western Region News

Photo: Volunteers show off a Chinese privet stump they removed along the Tuckasegee River at the November 10 Jackson County Greenway workday.
Fun Fridays on the Jackson County Greenway start January 12
Beginning in the New Year, every second Friday from January through April will be a fun Friday afternoon on the Jackson County Greenway! Community volunteer workdays will be held from 1-4 p.m. to control nonnative invasive plants and restore native habitat at the Jackson County Greenway in Cullowhee, NC. Our partners for these events include Jackson County Parks & Recreation, Mainspring Conservation Trust, and the WCU Center for Community Engagement and Service Learning. We’ll pull up roots, cut vines, and use hand tools to remove invasive shrubs (like Chinese privet) and then treat the stumps. No prior experience is necessary; we’ll provide tools and training. Please click here to register in advance so that we’ll have enough tools, gloves, etc. We have large and small tasks available, so you don’t have to be able to do strenuous physical labor to participate. Please, no pets. Email AmeriCorps service member Eve Davis with any questions.

Photo: Cuttings from living shrubs sprout new plants after being properly installed along the water’s edge.
Help protect water quality in Butternut Creek at the Union County Farmers Market
Join us at the Union County Farmers Market in Blairsville, GA, from 1-3 p.m. on Friday, January 26, to install live stakes along some small streams that flow into Butternut Creek. Live staking involves taking dormant cuttings of a living tree and planting them along the edge of a waterway. This is an easy, family-friendly event designed to get some native vegetation growing and protect water quality! The rain date for this event is February 2. Register here. Email Tony Ward for more information.
Save the date for the “Leap Day” 2024 Watershed Gala
Mark your calendars for the 16th Annual Hiwassee Watershed Gala set for Leap Day: Thursday, February 29, 2024! We look forward to an evening of laughter, fun, and camaraderie, and we’ll honor the 2024 Holman Water Quality Stewardship Award winner! There will again be an online silent auction starting ten days before the event on February 19. Click here to read about everything Gala-related and sign up to receive a notification when the auction begins.


Photos: Microscopic plastic fibers, films, and fragments are all found in Southern Blue Ridge water samples.
Coming soon: opportunities for microplastics sampling in Jackson & Macon counties
Our AmeriCorps service member, Eve Davis, is busily scouting locations for microplastics sampling sites in Jackson & Macon counties and adding to the list of sites that volunteers are already sampling in Swain County, NC. Water samples for microplastic analysis are collected quarterly by Western Region volunteers and dropped off at a central location in each county. If you’re interested in joining our 2024 sampling team, click here to complete our volunteer interest form. Click here to watch a 40-minute video about our microplastics sampling program.
Webinar: Why Should Environmentalists Support Building More Housing?
We know that healthy communities exist within the context of a healthy environment, and right now, both are threatened. There is a housing shortage across the country, with many hard-working families unable to find a place to live. There is also a climate crisis, with greenhouse gas emissions threatening the stability of all our planet’s ecosystems and biodiversity. Join us from 5:30-6:30 p.m. on January 22, 2024, to learn more about MountainTrue’s newest program, Neighbors for More Neighbors WNC, and about part of the solution to both these crises. This is a virtual event; registered participants will receive the webinar link prior to the event date. Register here.
Give!Local 2023
MountainTrue is honored to be among the 52 local nonprofits included in the 2023 Mountain Xpress Give!Local campaign. Click here to learn more about Give!Local and click here to donate to MountainTrue through the online giving campaign, which runs until December 31.
Changes to MountainTrue’s Guided Adventures
Beginning in 2024, Guided Adventures will be included in our monthly e-news. In an effort to reduce the number of emails you receive from us, we will no longer have a separate email launch for these. Please make sure to pay attention to the events section to grab your tickets. Current members will receive discounted tickets to select MountainTrue events. Also coming in 2024: discounted tickets for youth AND expanded volunteer opportunities in the Central Region. We hope to see you at a MountainTrue event next year!
Helping more of our neighbors find homes + putting a dent in our housing shortage in 2023
The Joint Center for Housing Studies at Harvard University recently released its annual “State of the Nation’s Housing” report. The report provides a detailed summary of US housing and rental market trends. Construction of multifamily housing has increased significantly year over year, slowing rent growth and raising vacancy rates in the rental market. However, there continues to be a vast housing shortage, especially homes affordable to low-income families. Follow our Neighbors for More Neighbors WNC program to learn how to help solve our housing shortage and the climate crisis.
Septic system repair grants available for qualifying property owners
MountainTrue has partnered with the North Carolina Department of Health and Human Services (DHHS) and local health departments to provide septic system repair grants to qualifying property owners in Cherokee County and others across WNC. Residents of rural areas outside of town are highly likely to have onsite septic systems. Problems with septic systems usually arise as systems age or when maintenance is neglected. Cherokee County is being prioritized because a long stretch of the Valley River is not safe for swimming due to bacterial contamination and leaking septic systems in older neighborhoods has been identified as one part of the problem. Macon County is also being prioritized based on new Swim Guide data in the Little Tennessee River in Franklin. Property owners: review eligibility requirements and apply for the repair program here.
Weigh in on opportunities to expand transit services across WNC
The Western North Carolina (WNC) Regional Transit Plan (RTP) is developing a transit study to evaluate current transit service in the region to identify improvements and enhance regional connectivity to the overall transit service. This survey will collect your thoughts about the community’s mobility needs and expectations for transit service, helping them shape the future of transit.