Sewage Spill in the Broad River? Check the Classifieds!
Check the Classifieds!
Disclaimer: this is not a sewage spill warning!
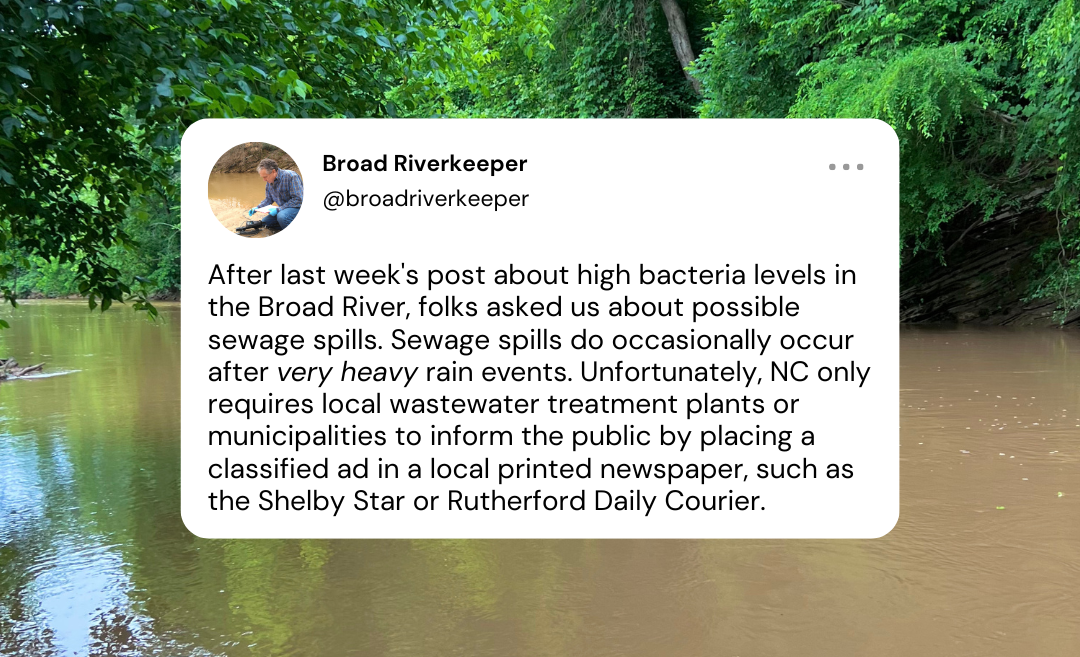
Thankfully, no recent sewage spills have been reported in the Broad River. Last week’s Broad Riverkeeper social media posts about high bacteria levels in the Broad got some folks wondering about bacteria levels and sewage spills. Heavy rainfall does cause E. coli levels in the Broad to rise, and sewage spills do occasionally occur after very heavy rain events. However, higher E. coli levels do not always signify a sewage spill.
In the event of a sewage spill, state law requires the wastewater treatment plant or municipality to inform the local public by placing a classified ad in a local printed newspaper.


Stay safe and informed on your river adventures.
This classified ad was printed in the Shelby Star on October 13, 2018, after nearly 45,000 gallons of untreated wastewater were discharged into the Second Broad River on October 11. The wastewater treatment plant was not required to directly notify your Broad Riverkeeper, the Broad River Greenway, or downstream neighbors. The treatment plant was also not required to place any signage downstream where folks might be accessing the river.
The protocol is an antiquated system for public notification of potentially dangerous pollution events. NC riverkeepers are urging the state to upgrade this system by utilizing more current communication methods like social media posts, email and text alerts, or a website. We’ll keep working to bring about a better system, but until then, make sure you know where to find potential future sewage spill notices in your local paper.


")